Use visualization in Jupyter notebook
Azure ML SDK is used in the command line mostly, but we also provide visualization for users in Jupiter notebook without going to the Azure machine learning website.
Prerequisite
SDK visualization based on pipelines, before we start to experience this feature, we need to create a pipeline as a prerequisite.
Jupyter notebook, or jupyter notebook integrate with other IDE (such as vscode)
The latest stable version of Azure ML SDK
Generate a pipeline, please refer to sample get-started to create a pipeline.
Visualization supported methods
Users can get a visualization graph to help better understanding the machine learning job via following 3 types of function call
Validate
pipeline.validate()
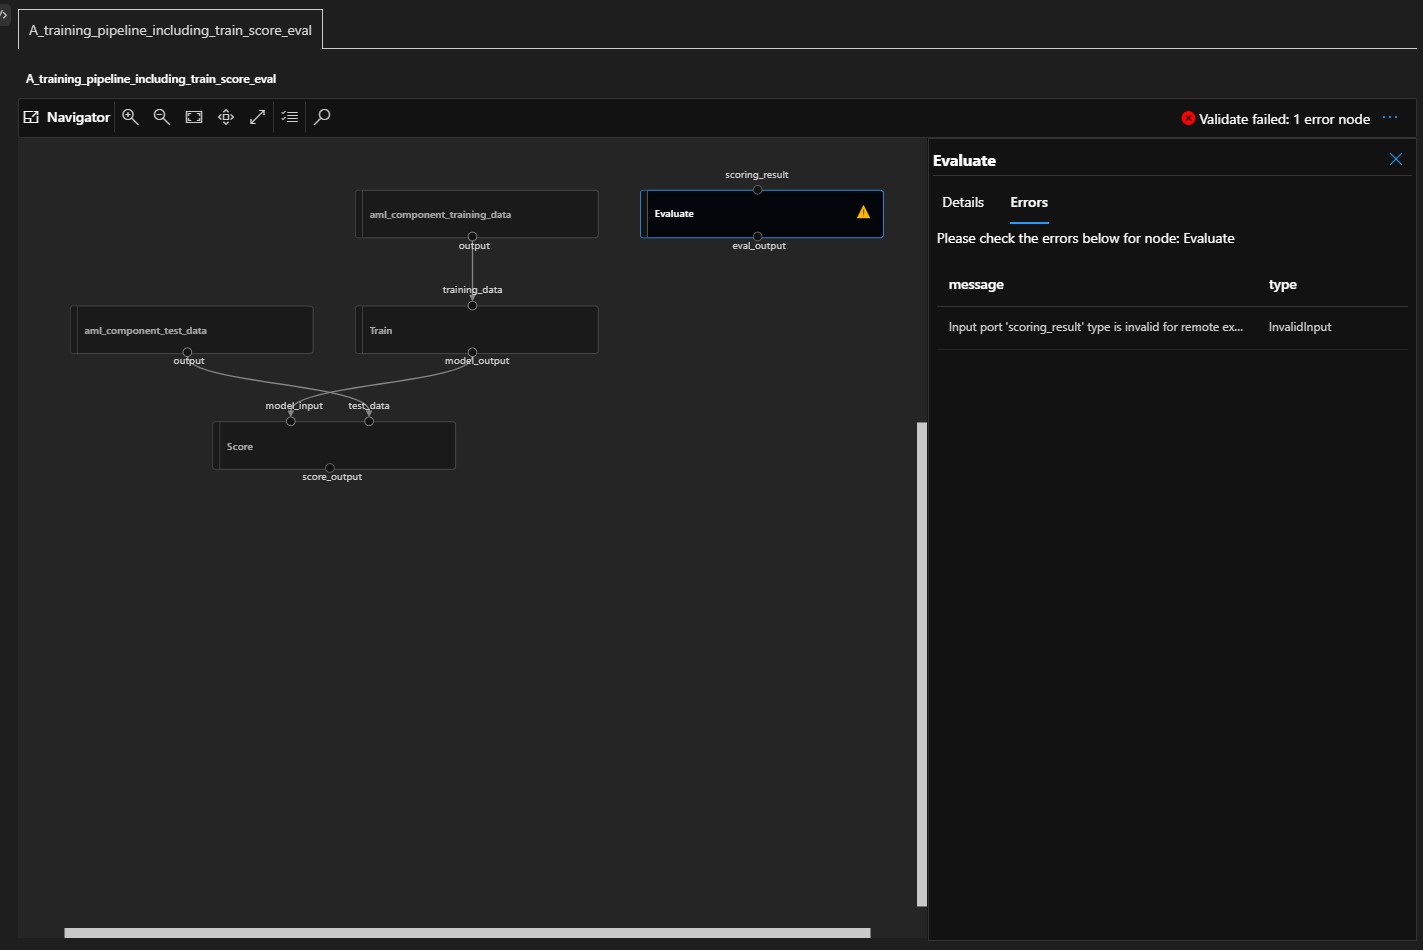
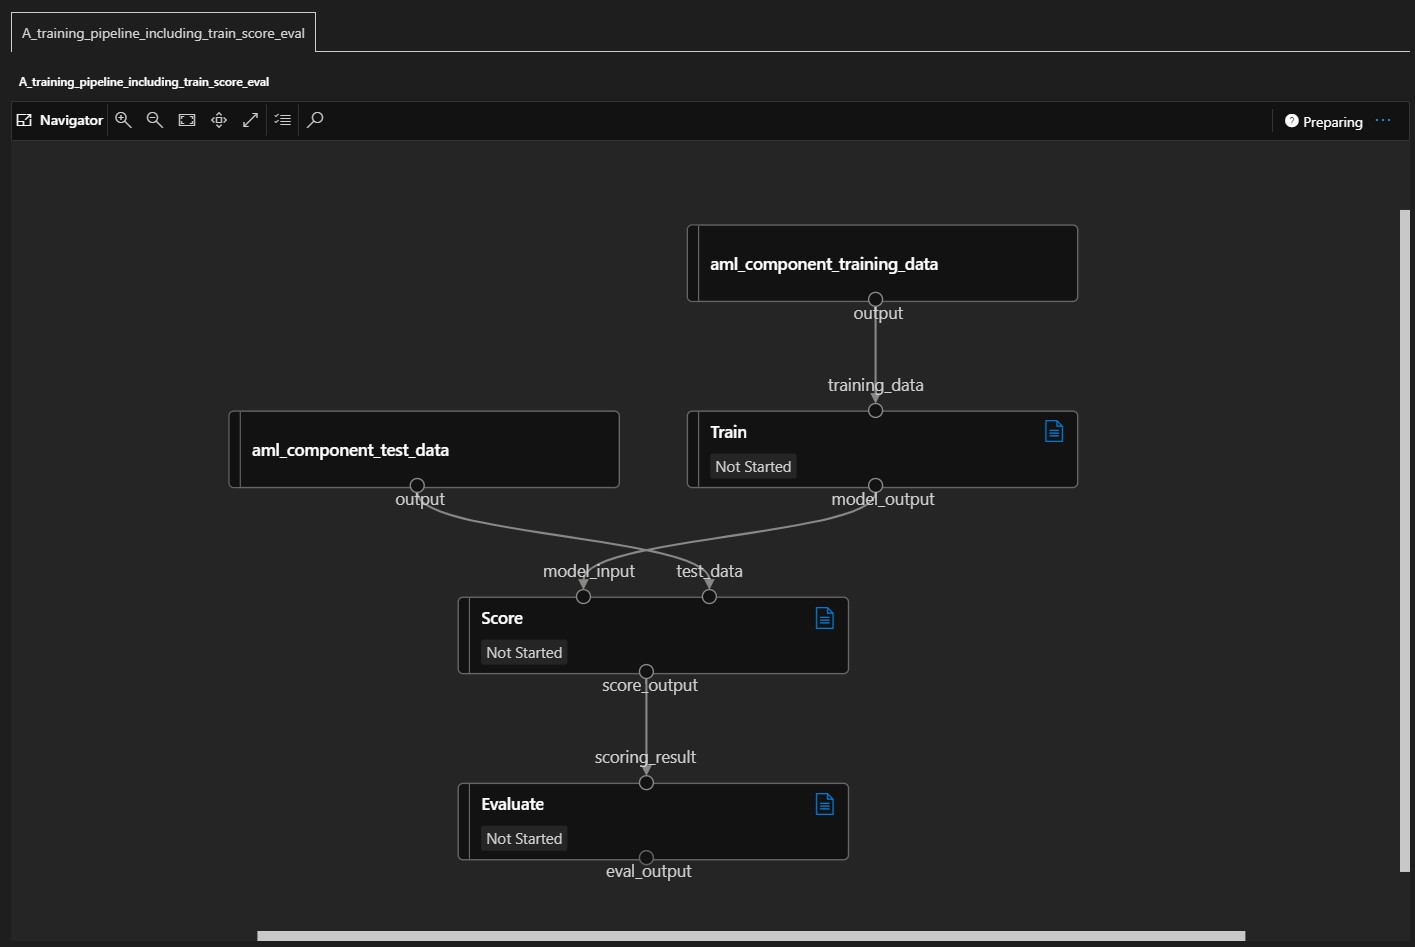
Each time when run pipeline.validate(), a supported dev environment will try to render a pipeline visualization graph. This graph is similar to the graph in the AML portal.
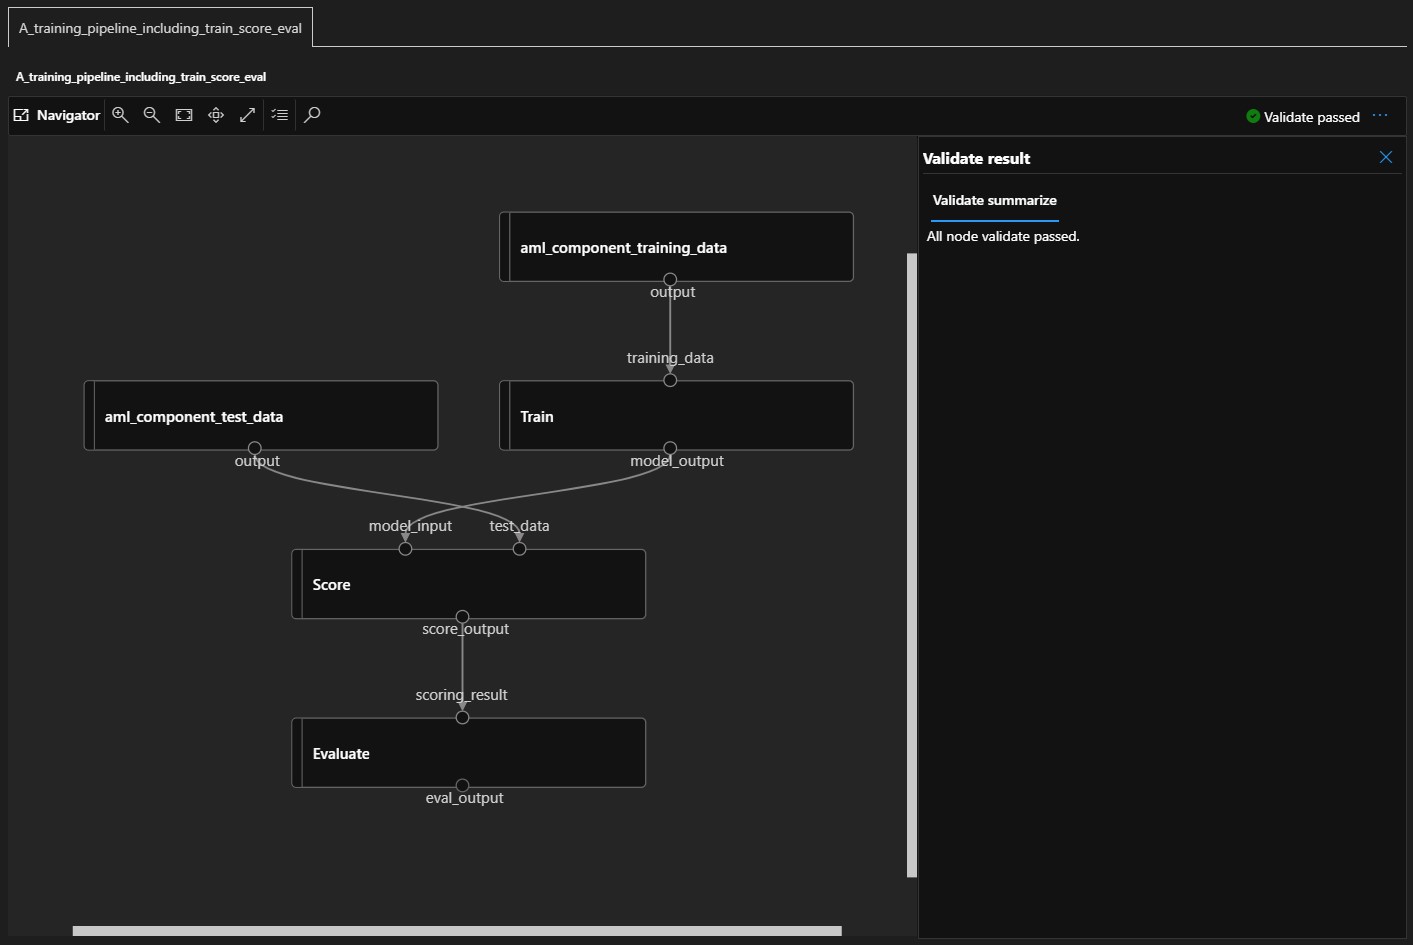
validate is used to check your pipeline before submitting, if there are errors been found locally, you may see relative nodes have been highlighted in the graph.
Running job visualize
Run pipeline remotely
pipeline.submit(experiment_name = 'pipeline-with-train-score-eval-components').wait_for_completion()
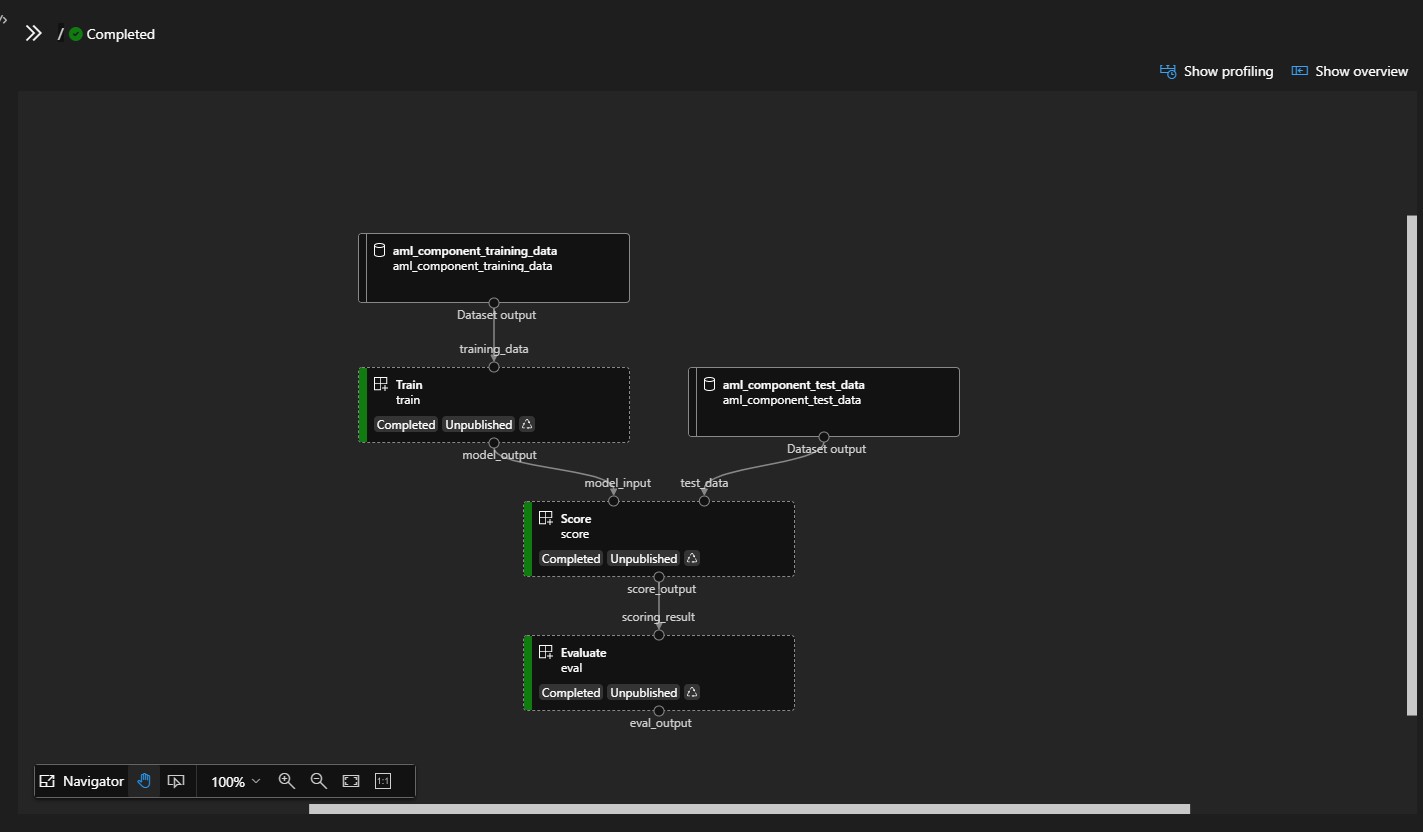
Azure ML SDK will help you keep update training status, you can also visit AML portal to get the latest status of your training job on other devices.
Users can see running overviews and logs by the “Show overview” button on the top-right of the visualization graph, and a node is also clickable when you want to see the detail of a specific node, a panel on the right will be expanded to show relative details and running logs, it should be helpful for users who want to monitor the job running process.
Run pipeline locally
pipeline.run(experiment_name = 'pipeline-with-train-score-eval-components', mode='host')
Same as remote run, the SDK will keep updating training status and logs on the visualization graph when jobs running, just leave and take a coffee then wait for your job to complete.
Profiling
Once your job has been submitted successfully, you can use the profiling tool to analyze your pipeline to find out the performance of every step in your job. Please note that only jobs submitted to remote from AzureML SDK has an entry for profiling. Following features may useful for your jobs in profiling tools
Playback
Gantt chart with critical path for time spent
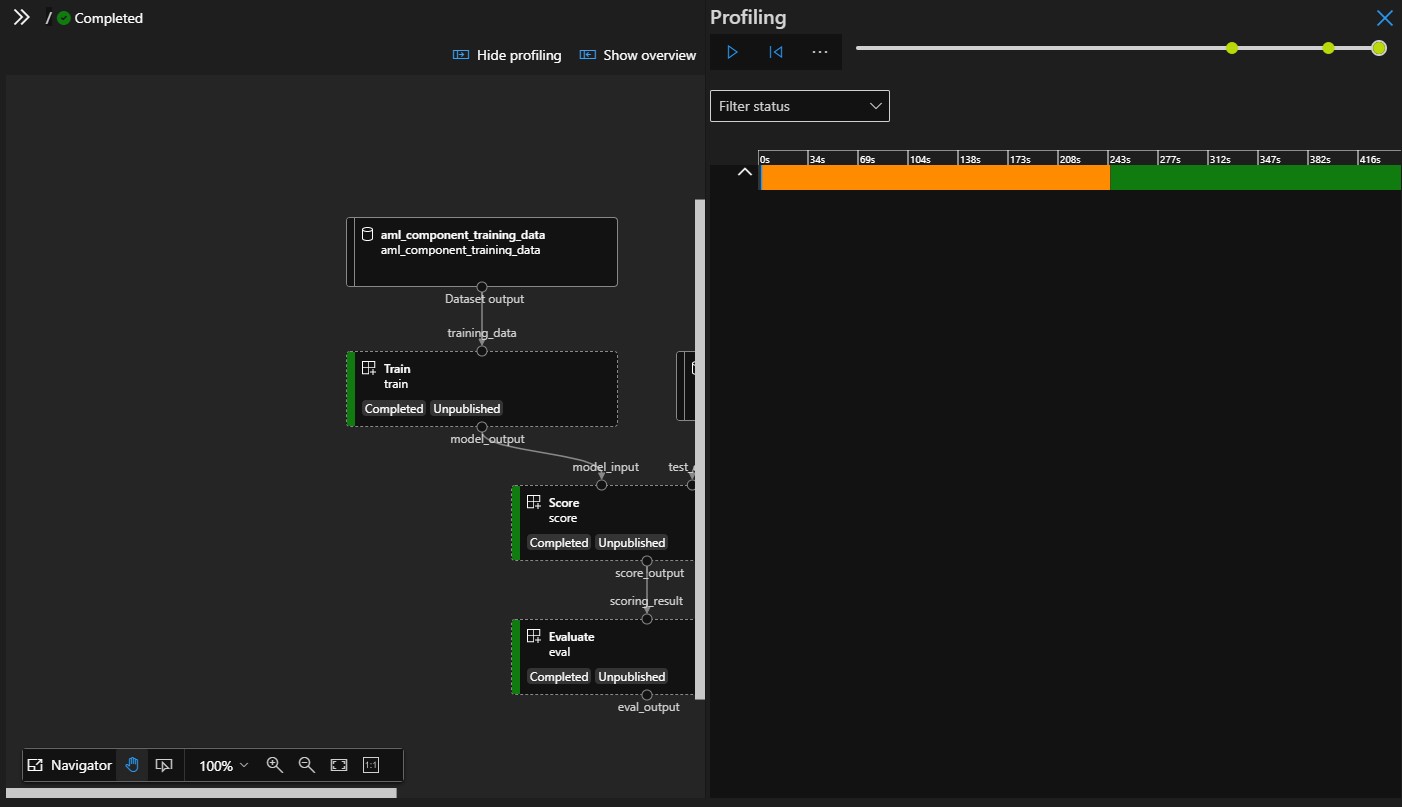
Similar to most types of profiling tools you met in other applications, our profiling tools provide a record of your training process, you can use this record to found time spent at every step in your job. The playback feature should be useful for performance analysis, it’s easy to jump between steps in profiling tools.
The demo job in sample get-started is too simple, let’s use another job to show how the profiling tools work.